After a great Super Bowl game my thoughts turn, of course, to what was happening with our infrastructure during the game. Last week ISO New England put out an article analyzing New England usage during last year’s Super Bowl. (Article can be found here.) The article showed this nice chart showing noticeable movements in the demand curve at various parts of the game.

Source: ISO New England
Then I found an article analyzing electricity usage during the last five Super Bowls. (Article can be found here.) Again some impact from the game is usually noticeable from the data. However, the problem is that there are so many other factors that can impact demand the Super Bowl influence can get lost.
While electricity use can be influenced by outside factors, water use is a little more stable. There was an article in the NY Post after the Super Bowl in 2012 (see here) that said that toilet use in NYC spiked 13% after the game.
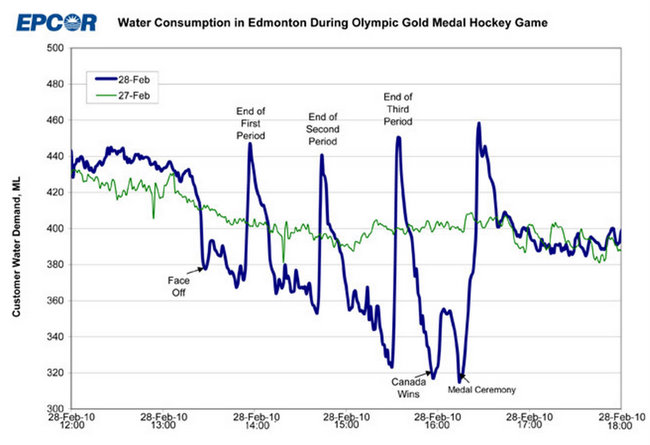
One of my favorite charts is from the city of Edmonton showing water usage during the 2010 Olympic hockey gold medal game when Canada had a dramatic overtime victory. The changes in water usage are very significant.

Source: https://www.patspicks.com/blog/item/what_if_everybody_flushed_at_once_Edmonton_water_gold_medal_hockey_game/
The same blog created a similar water consumption chart for Palm Beach County Florida during the Super Bowl in 2011, which showed significant movement, though not quite as much as for the previous year’s hockey game.

Source: https://www.patspicks.com/blog/item/everybody_flush_at_once_the_super_bowl_water_use_consumption_NFL_pee/