There was a front page story in today’s Wall Street Journal (see here), discussing the pressures sell-side analysts face to give positive ratings to the companies they follow. Analysts compensation is often influenced by the number of management meetings they can arrange for clients. The article claims that managements often won’t talk with a particular analyst if that person has a sell rating on the stock.
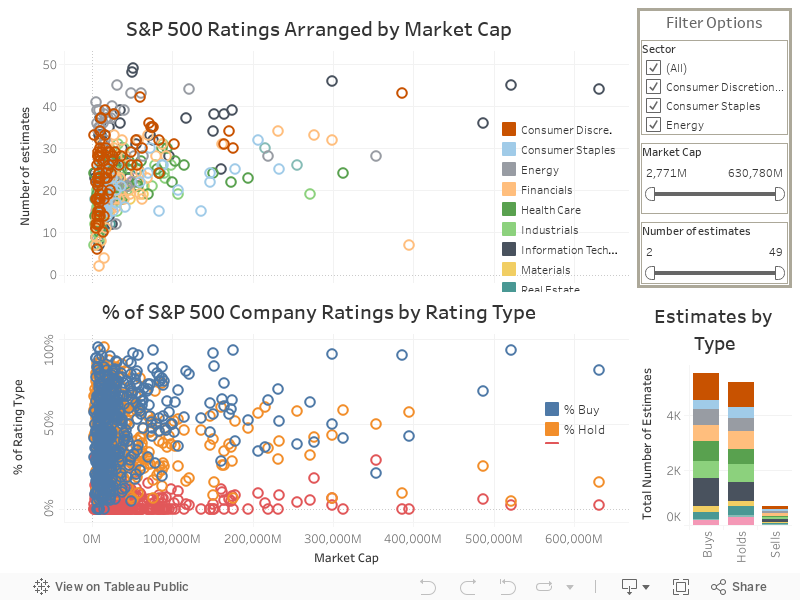
Using data from FactSet, I found the broker ratings for all the members of the S&P 500. I then plotted out the number of stock ratings for each company arranged by market cap, as well the percentage of these ratings that were buys, holds, and sells. The viz I created is available on Tableau Public here and is embedded at the end of this web post, which allows you to manipulate the data in various ways. In the Rating Type chart you can see that no company in the S&P has more than 41% sell ratings, while there are a number of companies where over 90% of the ratings are buys.
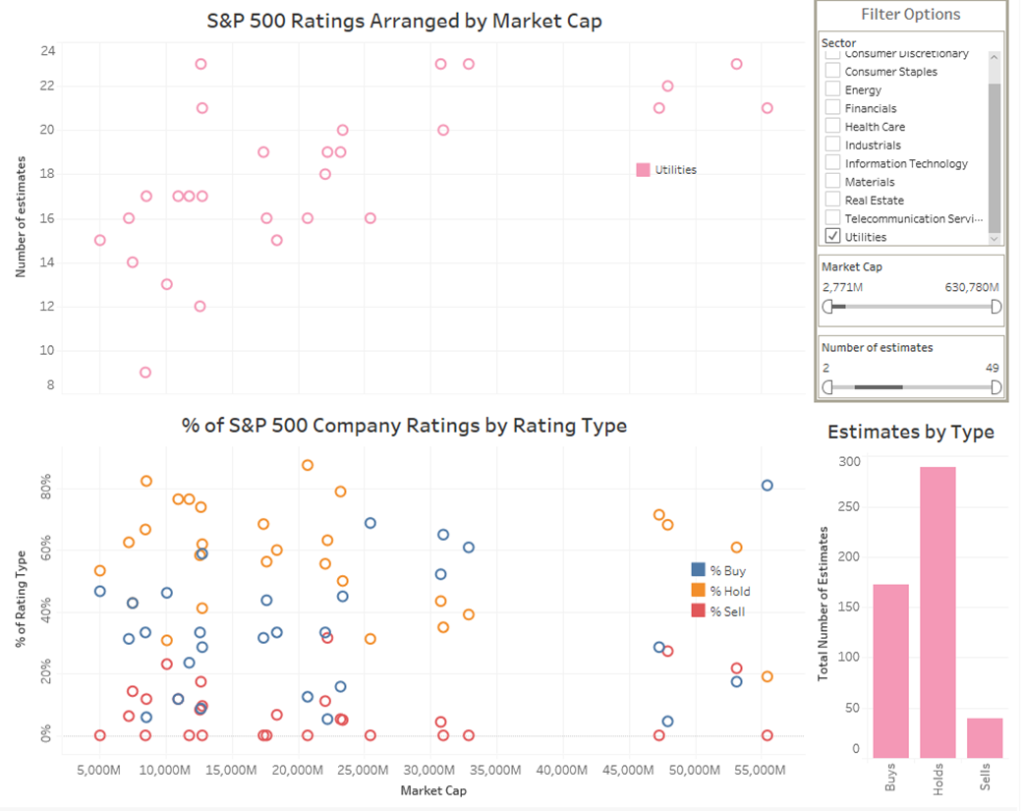
I have also included a screen shot of the data showing only the utility sector. While the S&P 500 as a whole currently have more buys than either holds or sells, in the utility sector the biggest rating by far is hold. Also, about 8% of utility ratings are sell, while only 6% of the entire S&P 500 has a sell rating. Obviously analysts seem to be quite bearish on the utility sector right now. The fear of a rising interest rates after so many low years is a likely culprit. It might actually make sense that there could be some herd protection for analysts covering this group. If most analysts are giving low ratings, managements can’t really use a low rating as an excuse to avoid meetings.
Below is the interactive version. Enjoy!