This morning’s RBN Energy blog post had a good discussion about current natural gas storage levels. (see blogpost here) Gas storage levels are at the lowest level for this time of year since 2005. An important point the blog raises is that the natural gas market is dramatically different than it was 13 years ago. In 2005 the US consumed about 60 BCF of gas per day throughout the year. In 2017 that figure was 74 BCF per day. Then if you add exports on top of that, which averaged almost 10BCF/day this past July (compared to average exports of about 2BCF/day back in 2005) you have a dramatically different market. When you think of today’s storage levels on a days of inventory basis you get something much lower than 2005 levels. An interesting point RBN makes is that the market seems to now be looking at our coal stockpiles at power plants and our LNG export capacity as “shadow” gas capacity that will get used if gas demand increases too much. This definitely makes sense on a long term average basis, where if gas inventories get too low consumption can shift away to these other sources. However, on super peak demand days this “shadow” capacity really disappears because all of those coal power plants would be running anyways to meet demand and shutting off LNG exports might not help get around some pipeline bottlenecks.
Besides todays RBN piece, the EIA wrote an article on this inventory subject that gives some further information about this issue. (See EIA piece here)
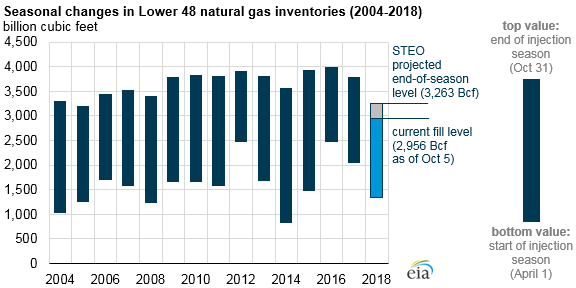
Here is a chart from that EIA piece showing storage levels going back to 2004:
 Source: EIA